

The Impact of Online Hate Mongering
An Exploratory Analysis of @LibsOfTikTok
Research Question
When the Libs Of Tik Tok Twitter account mentions specific geographic locations, how frequently these targets experience real world/digital harassment, and how soon after being targeted does this harassment occur?
Context
Libs Of Tik Tok is a prolific Twitter account run by Chaya Raichik. This account serves as one of the largest promoters of conspiracy theories and harassment against the LGBTQIA+ community since Pride Month in June of 2022. The account often posts visual media purporting to be evidence that LGBTQIA+ events and individuals are “groomers”, or that these events or individual are attempting to prey on children. Similar unfounded conspiracy theories about the LGBTQIA+ community have been used to justify harassment and violence against this community for decades in the United States. There is no evidence that the LGBTQIA+ community intentionally or systematically engages in any behavior that could be construed as predatory towards minors. However, there is a large body of reporting and analysis that shows that the “groomer” conspiracy theory is becoming an increasingly used justification for real world violence against members of the LGBTQIA+ community.
Methodology
Task Force Butler researchers archived Libs of Tik Tok Tweets from April 26, 2022 to November 21, 2022. Researchers then filtered the dataset for Tweets that directly mention a city or state in the United States. Researchers then manually analyzed this subset of Tweets to identify Tweets that included targeting information against a person, place, or event. Researchers then searched for reports or evidence of real world or digital harassment against the person/place/event mentioned by the Libs of Tik Tok Twitter account and documented the type and time of incidents that occurred after Libs of Tik Tok tweeted targeting information about that specific person, place, or event.
The original dataset consists of 3,171 Tweets. When filtered by Tweets containing cities and/or states, we produced a subset of 478 Tweets. Of those 478 Tweets, researchers identified 281 Tweets which included targeting information about a location, event, or person. Of these 281 Tweets, we identified 66 Tweets which included targeting information that subsequently experienced real-world or digital harassment.
Analysis
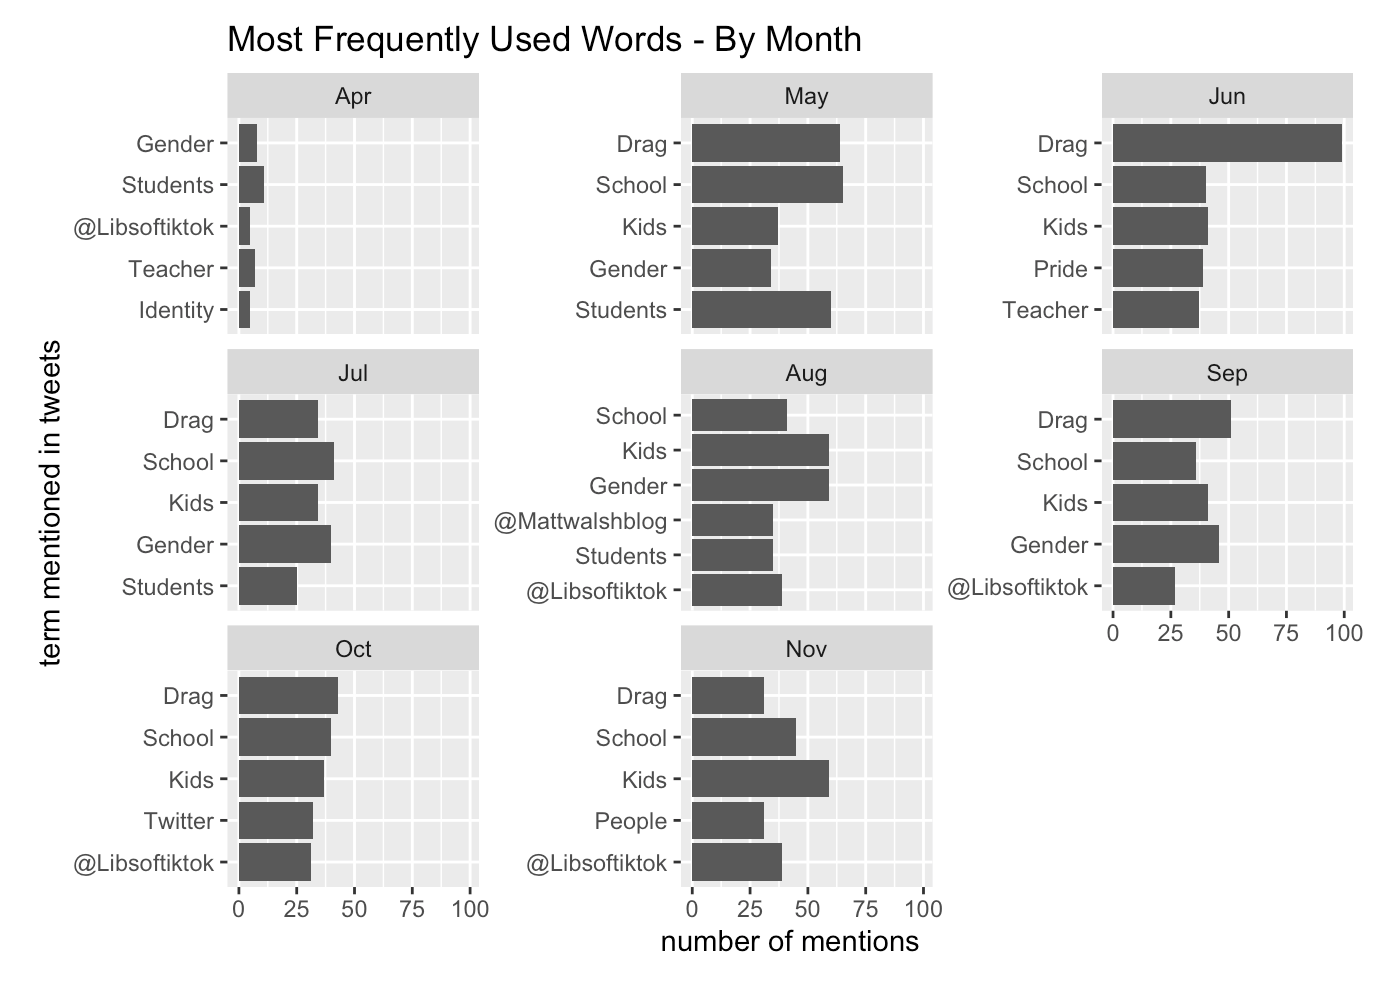
Within the overall dataset of Tweets, the five most used words by Libs of Tik Tok during the date range were “drag”, “school”, “kids”, “gender”, and “family”. Of note is the frequency in which specific target types were mentioned, specifically “drag”, “school”, “teacher”, and “Queen”.

The LibsOfTikTok account calls out geographic locations consistently – about 10% of the account’s Tweets mention a city or a state.

Not all “location Tweets” become targets of harassment. Of 3,171 Tweets, we algorithmically identified 418 Tweets that specifically mention a location (city or state). Of these, 281 had specific targets (either a place or a person within the city/state). The remaining 137 Tweets mentioned general locations without any specific target.
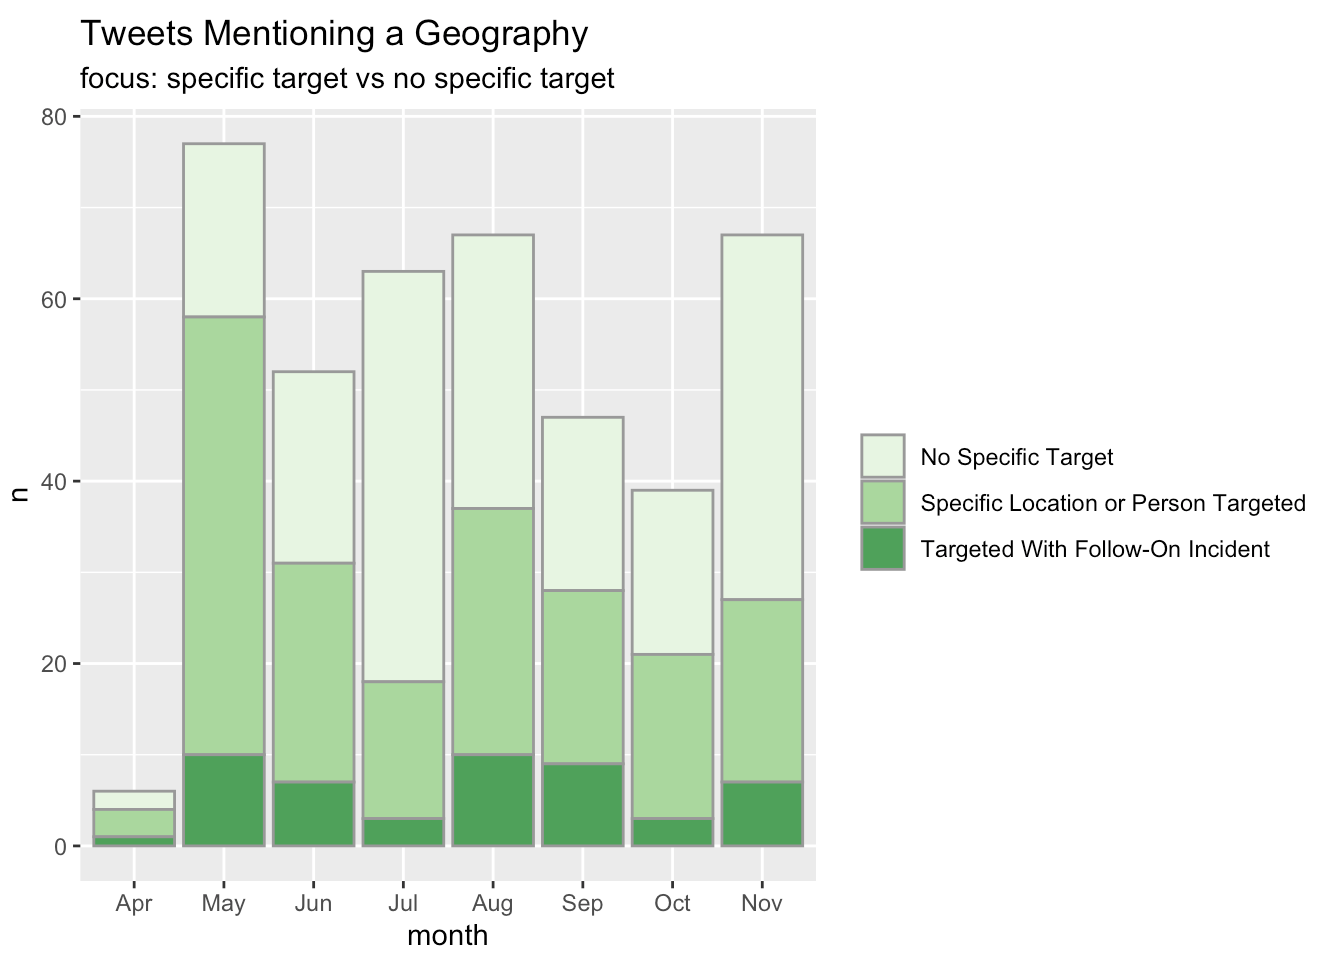
Out of 281 Tweets we identified as including targeting data against a person/place/thing, 66 of those targets experienced some form of real world or digital harassment within three months of the LoTT Tweet. In other words, almost one in four locations, events, or individuals that were directly targeted by LibsofTikTok experienced some form of digital or real world harassment or other consequence after being profiled by the account.
On average, Tweets about targets that subsequently experienced real world or digital harassment seem to experience this harassment with 17 days of LibsofTikTok directly referencing the target.
Half of all targets of LoTT’s digital harassment experienced real-world consequences within 5 days of the Tweet.

The time delay between Tweet and real-world incident has been steadily decreasing. While the average over the entire period is 17 days, in more recent months the number of incidents with 0-1 days between Tweet and action is increasing.

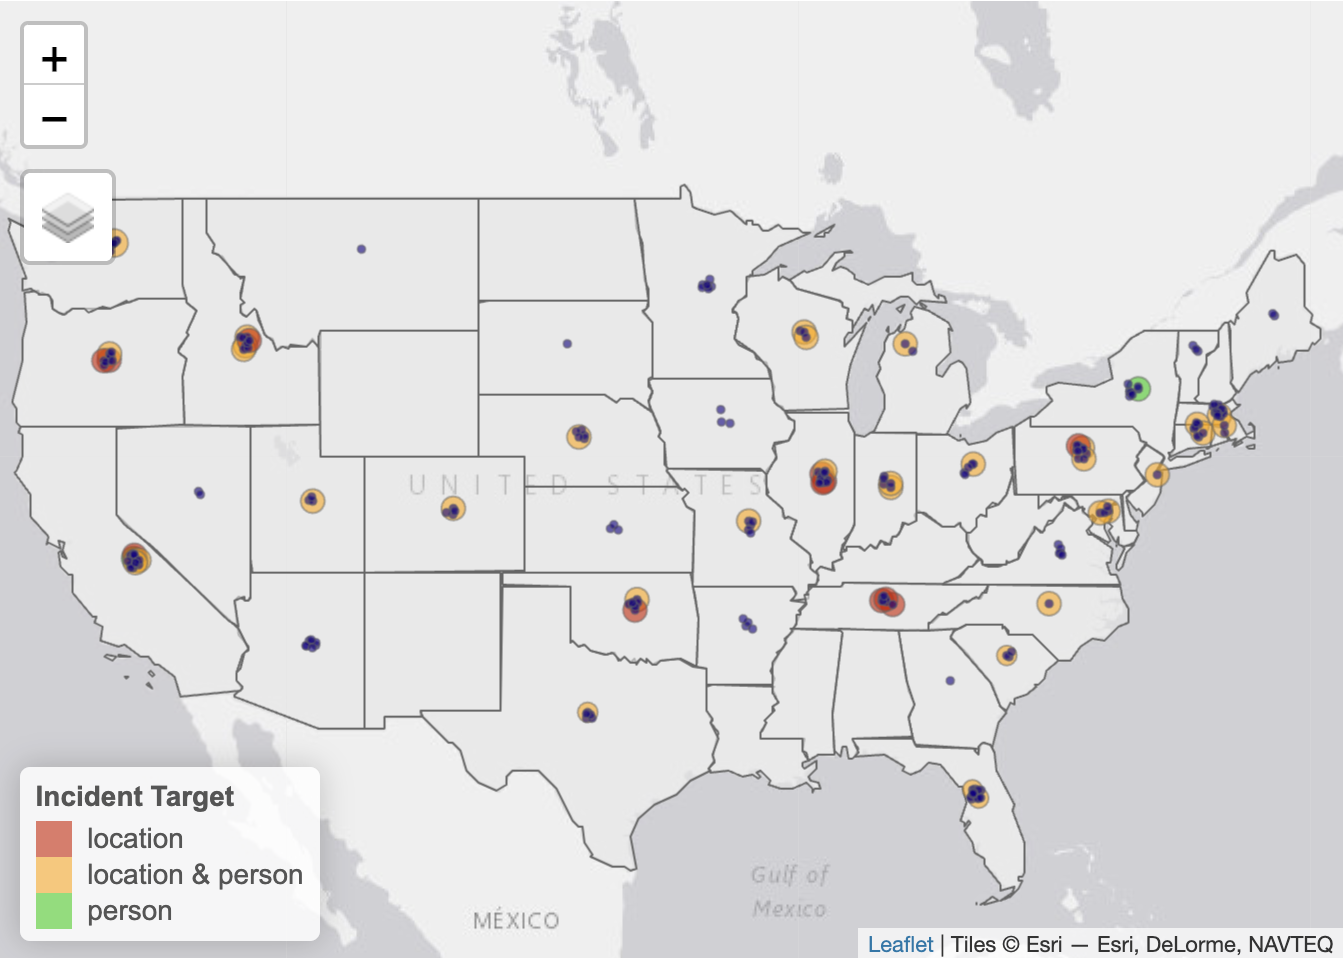
Map Layout: Tweets and Incidents
Finally, we laid out all the geographic data on a map of the US. Here the small blue points indicate a Tweet mentioning a specific target (location or person); the larger circles are incidents tied to Tweets. The circles are colored by what type of target was involved - person or location.
This map shows all of the Tweet-connected incidents for the entire span of time coverd by this analysis. The map is interactive: scroll to zoom in/out. Click on any Tweet or incident to get mnore information.
Limitations
This initial analysis focused on geographic information shared within a Libs of Tik Tok Tweet. This means that only Tweets which directly reference a city or state in the text of the Tweet were analyzed.
While this research implies a relationship between Libs of Tik Tok’s posting activity and real world or digital harassment. It does not prove a statistically correlative relationship between Libs of TikTok and harassment.
Our research relies on subject matter expert judgement on what constitutes digital and real world harassment, as well as manually coded data and research regarding incidents related to targets. It can, therefore, either understate or overstate the actual relationship.
This phase in our research only included publicly reported incidents, meaning target Tweets that do not have an associated incident may in fact have led to real world and/or digital harassment, but lacked social media or journalistic reporting about said incidents.